Programming Collective Intelligence 笔记
副标题Building Smart Web 2.0 Applications,作者Toby Segaran。
只大概记了一些要点,做课后的练习,具体内容看示例代码最有效。
Python一直没用熟,代码风格有待改善。
Preface
This book covers ways to get hold of interesting datasets from many web sites you’ve probably heard of, ideas on how to collect data from users of your own applications ,and many different ways to analyze and understand the data once you’ve found it.
本书的代码用的是Python2。在Windows下如果同时安装了Python2和3,在终端里输入py -2就是Python2,py -3就是Python3。
Overview of the Chapters
- Chapter 1, Introduction to Collective Intelligence
Explains the concepts behind machine learning, how it is applied in many different fields, and how it can be used to draw new conclusions from data gathered from many different people. - Chapter 2, Making Recommendations
Introduces the collaborative filtering techniques used by many online retailers to recommend products or media. The chapter includes a section on recommending links to people from a social bookmrking site, and building a move recommendation system from the MovieLens dataset. - Chapter 3, Discovering Groups
Builds on some of the ideas in Chapter 2 and introduces two different methods of clustering, which automatically detect groups of similar items in a large dataset. This chapter demonstrates the use of clustering to find groups on a set of popular weblogs and on people’s desires from a social networking web site. - Chapter 4, Searching and Ranking
Describes the various parts of a search engine including the crawler, indexer, and query engine. It covers the PageRank algorithm for scoring pages based on inbould links and shows you how to create a neural network that learns which keywords are associated with different results. - Chapter 5, Optimization
Introduces algorithms for optimization, which are designed to search millions of possible solutions to a problem and choose the best one. The wide variety of uses for these algorithms is demonstrated with examples that find the best flights for a group of people traveling to the same location, find the best way of matching students to dorms, and lay out a network with the minimum number of crossed lines. - Chapter 6, Document Filtering
Demonstrates Bayesian filtering, which is used in many free and commercial spam filters for automatically classifying documents based on the type of words and other features that appear in the document. This is applied to a set of RSS search results to demonstrate automatic classification of the entries. - Chapter 7, Modeling with Decision Trees
Introduces decision tree as a method not only of making predictions, but also of modeling the way the decisions are made. The first decision tree is built with hypotheticl data from server logs and is used to predict whether or not a user is likely to become a premium subscriber. The other examples use data from real web sites to model real estate prices and “hotness”. - Chapter 8, Building Price Models
Approaches the problem of predicting numerical values rather than classifications using k-nearest neighbors techniques, and applies the optimization algorithms from Chapter 5. These methods are used in conjunction with the eBay API to build a system for predicting eventual auction prices for items based on a set of properties. - Chapter 9, Advanced Classification: Kernel Methods and SVMs
Shows how support-vector machines can be used to match people in online dating sites or when searching for professional contacts. Support-vector machines are a fairly advanced technique and this chapter compares them to other methods. - Chapter 10, Finding Independent Features
Introduces a relatively new technique called non-negative matrix factorization, which is used to find the independent features in a dataset. In many datasets the items are constructed as a composite of different features that we don’t know in advance; the idea here is to detect these features. This technique is demonstrated on a set of news articles, where the stories themselves are used to detect themes, one or more of which may apply to a given story. - Chapter 11, Evolving Intelligence
Introduces genetic programming, a very sophisticated set of techniques that goes beyond optimization and actually builds algorithms using evolutionary ideas to solve a particular problem. This is demonstrated by a simple game in which the computer is initially a poor player that improves its skill by improving its own code the more the game is played. - Chapter 12, Algorithm Summary
Reviews all the machine-learning and statistical algorithms described in the book and compares them to a set of artificial problems. This will help you understand how they work and visualize the way that each of them divides data. - Appendix A, Third-Party Libraries
Gives information on third-party libraries used in the book, such as where to find them and how to install them. - Appendix B, Mathematical Formulas
Contains formulae, descriptions, and code for many of the mathematical concepts introduced throughout the book.
Introduction to Collective Intelligence
Netflix, Google. The ability to collect information and the computational power to interpret it has enabled great collaboration opportunities and a better understanding of users and customers.
Collective Intelligence: The combining of behavior, perferences, or ideas of a group of people to create novel insights. Building new conclusions from independent contributors.
Machine Learing目前的缺陷是很多信息利用不上和overgeneralizing。
使用ML的一些例子:Search Engine(Google), Recommendation System(Amazon, Netflix), Prediction Markets(Hollywood Stock Exchange), Dating Sites(eHarmony)。还可以应用在很多其他领域。比如:
- Product marketing
Understanding demographics and trends are make easier by the increased ability to collect data from consumers and use machine learning techniques such as clustering to better understand the natural divisions that exist in markets and to make better predictions about future trends.
Making Recommendations
- User-Based Filtering
Simpler to implement, more appropriate with smaller in-memory datasets that change very frequently.
topMatches是通过某种算法(如Euclidean Distance Score或Pearson Correlation Score或其他)计算出每个user和其他user的相似性,然后按照相似程度排序得到最匹配的其他user。
getRecommendations是计算出每个其他user与自己的相似性之后,再将该user看过的其他电影的评分与相似性相乘,讲所有user的该值求和再除以总的相似性之和,得到每个电影的一个加权相似值,排序则得出最符合此user品味的推荐项。 - Item-Based Filtering
Faster, need to maintaining the item similarity table, performs better in sparse datasets.
calculateSimilarItems是讲之前的用户数据反过来,变为item主导的,然后用topMatches找到与自己最相似的其他item。
getRecommendedItems是针对该user的每个item,找到其用calculateSimilarItems计算出的n个相似item,然后类似前文求出每个item的的加权相似值,排序得出最符合此user品味的推荐项。
Exercises
- Tanimoto score. Find out what a Tanimoto similarity score is. In what cases could this be used as the similarity metric instead of Euclidean distance or Pearson coefficient? Create a new similarity function using the Tanimoto score.
答: 参考
Used when each attribute is binary such that each bit represents the absence of presence of presence of a characteristic, thus, it is better to determine the similarity via the overlap, or intersection, of the sets.
The Tanimoto Coefficient uses the ratio of the intersecting set to the union set as the measure of similarity. Represented as a mathematical equation. In this equation, N represents the number of attributes in each object(a,b). C in this case is the intersection set.

1 | def sim_tanimoto(prefs, p1, p2): |
- Tag similarity. Using the del.icio.us API, create a dataset of tags and items. Use this to calculate similarity between tags and see if you can find any that are almost identical. Find some items that could have been tagged “programming” but were not.
答:由于del.icio.us网站挂了,随便伪造了一点数据。
1 | tags = { |
- User-based efficiency. The user-based filtering algorithm is inefficient because it compares a user to all other users every time a recommendation is needed. Write a function to precompute user similarities, and alter the recommendation code to use only the top five other users to get recommendations.
1 | def calculateSimilarUsers(prefs,n=5,similarity=recommendations.sim_pearson): |
- Item-based bookmark filtering. Download a set of data from del.icio.us and add it to the database. Create an item-item table and use this to make item-based recommendations for various users. How do these compare to the user-based recommendations?
1 | def getDeliciousRecommendationItem(tag): |
- Audioscrobbler. Take a look at http://www.audioscrobbler.net, a dataset containing music preferences for a large set of users. Use their web services API to get a set of data for making and building a music recommendation system.
Discovering Groups
data clustering, a method for discovering and visualizing groups of things, people, or ideas that are all closely related.
Clustering is used frequently in data-intensive applications. Retailers who track customer purchases can use this information to automatically detect groups of customers with similar buying patterns, in addition to regular demographic information. People of similar age and income may have vastly different styles of dress, but with the use of clustering, “fashion islands” can be discovered and used to develop a retail or marketing strategy.
Supervised versus Unsupervised Learning
- Supervised Learning
use example inputs and outputs to learn how to make predictions
neural networks, decision trees, support-vector machine, Bayesian filtering, etc. - Unsupervised Learning
not trained with examples of correct answers. Their purpose is to find structure within a set of data where no one piece of data is the answer.
clustering, non-negative matrix factorization, self-organizing maps, etc.
博客聚类示例的思路:
- 获得博客词频数据。数据是某Blog的某词次数的count。适合用Pearson correlation计算distance。
- Clustering.
- Hierarchical Clustering.
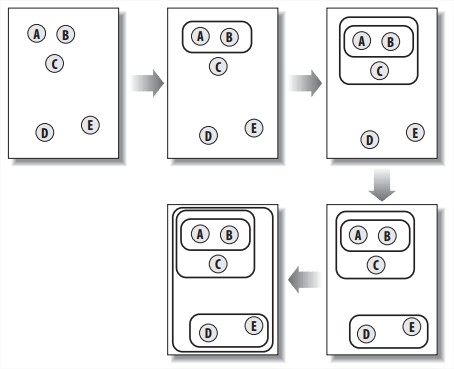
算法是每一步计算当前group们之间的距离,找出最小距离的两个group,聚合成一个group。不断重复,直到最后只剩一个group。
每一个group的数据结构bicluster表示为,有left/right/vec/id/distance,要么是一个代表实际blog的叶节点,要么是有来源两个group的group。
效率很低,唯一的优化是备忘录,缓存下两group之间的距离数据避免每次都计算。
- K-Means Clustering.
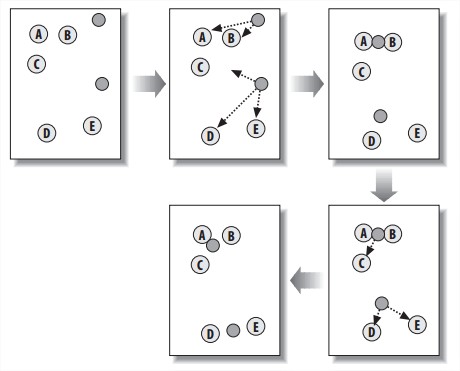
算法是随机在空间中放k个中心点,然后把每个item指给离自己最近的中心点。中心点随后移到指向自己的所有item的中间位置。然后每个item重新指给离自己最近的中心点。重复直到item们的指向都稳定。
- Hierarchical Clustering.
兴趣聚类示例的思路:
- 获得兴趣网站zebo里的数据。用Beautiful Soup。数据是某User有此Item则为1,无则为0。适合用Tanimoto coefficient计算distance。
- Clustering。用和前文一样的方法,因为数据结构都一样。作者还建议考虑年龄因素,看看大家的欲望有何不同。
对显示方式的优化:
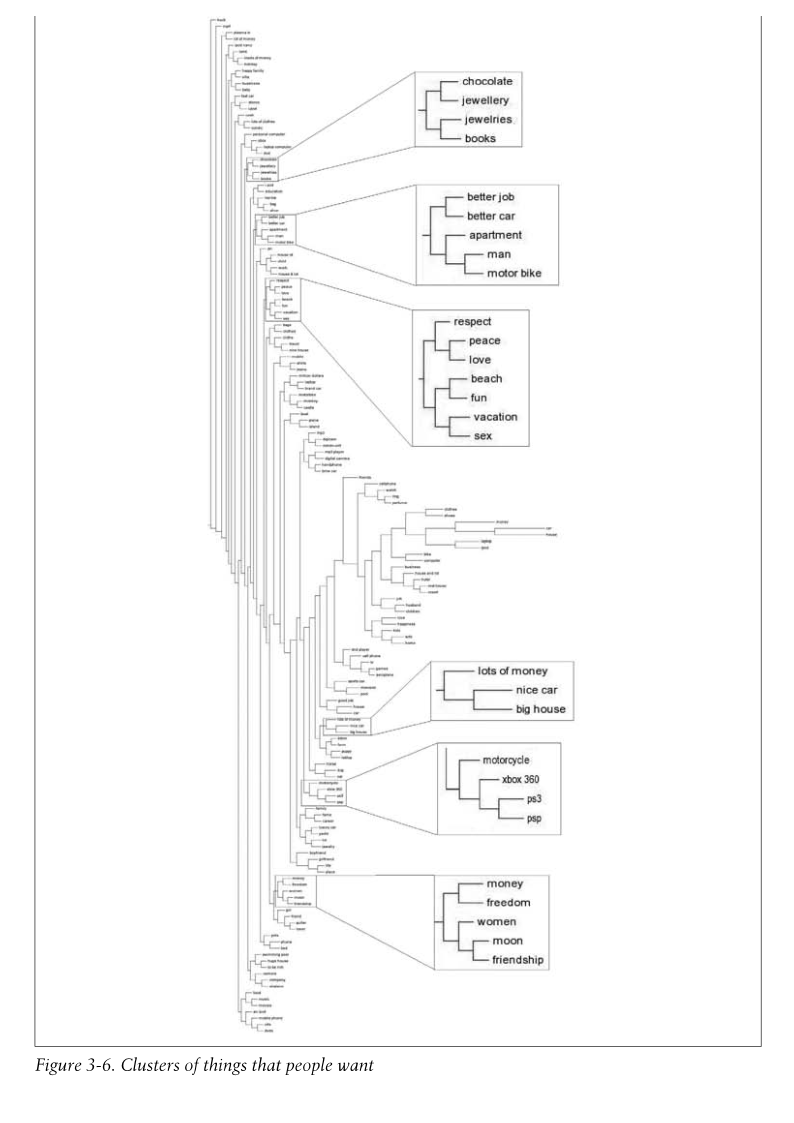
- Dendrogram。
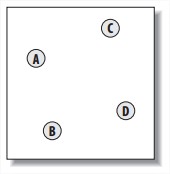
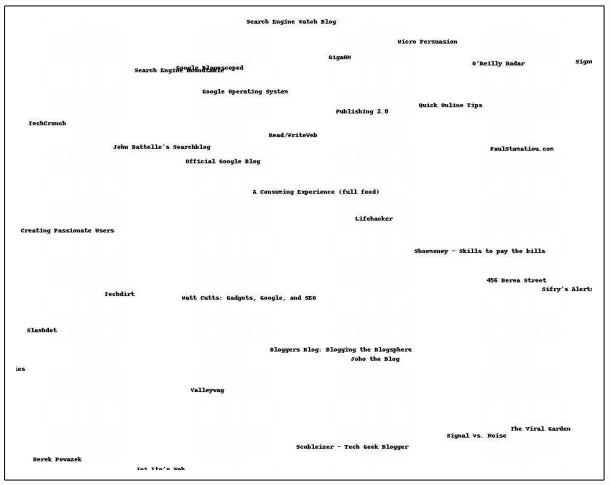
- 为便于理解数据将其处理为二维。multidimensional scaling。(并不局限在二维,一维三维也都可以。)
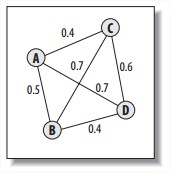
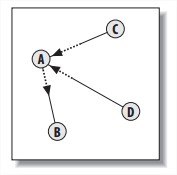
原理是计算出两个item(如blog)之间的距离,讲所有这些item随机画在一个二维平面上,然后计算他们error的总和,并每次循环向正确的方向调整一点,直到error总和值不再变化为止。

Searching and Ranking
Search Engine:
-
Crawling
收集网页数据。用urllib2(加载)和Beautiful Soup(解析)。 -
Building the Index
将处理过的数据存进数据库。用SQLite,python的实现叫pysqlite。
数据库结构是:
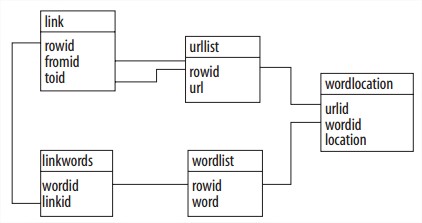
urllist:被索引到的URL。
wordlist:URL中文本中的所有词。
wordlocation:每个词在每个URL中出现的位置。
link:两个URL之间的指向关系。
linkwords:某个词是否出现在某个link的描述文本中。 -
Querying
返回一个有序的URL列表,排序方法可以有:- Content-based ranking
- Word frequency. The number of times the words in the query appear in the document can help determine how relevant the document it.
- Document location. The main subject of a document will probably appear near the beginning of the document.
- Word distance. If there are multiple words in the query, they should appear close together in the document.
- Inbound-link ranking
- Simple Count
有多少页面外链到它,直接计数。 - The PageRank Algorithm
Google创始人发明的。每个页面都被赋予一个重要值。一个页面的重要值是由所有链接到它的其他页面的重要值决定的。
例子:Pages B, C, and D all link to A, and they already have their PageRanks calculated. B also links to three other pages and C links to four other pages. D only links to A. To get A’s PageRank, take the PageRank(PR) of each of the pages that links to A divided by the total number of links on that page, then multiply this by a damping factor of 0.85, and add a minimum value of 0.15. The calculation for PR(A) is:
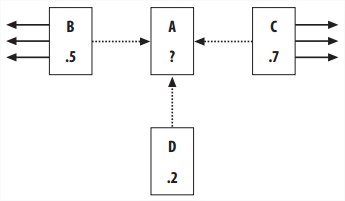

注意到例子里BCD的PageRank是已经计算好的。事实上,在初始状态,每个page都被指定给一个初始值,然后多次迭代进行上述计算过程。对于一个小项目来说,迭代20次差不多就够了。 - Using the Link Text
Use the text of the links to a page to decide how relevant the page is.
- Simple Count
- Content-based ranking
-
Learning from Clicks
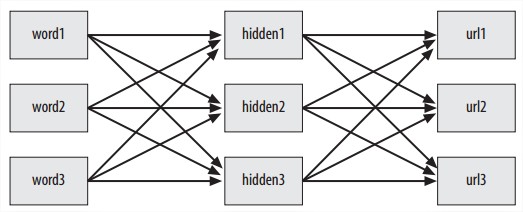
Build a neural network for ranking queries. The neural network will learn to associate searches with results based on what links people click on after they get a list of search results. The neural network will use this information to change the ordering of the results to better reflect what people have clicked on in the past.
Multilayer perceptron(MLP)- 神经网络的设计:
- 数据库结构设计:
hiddennode:存储hidden layer。
wordhidden:存储从word layer到hidden layer的连接。
hiddenurl:存储从hidden layer到url layer的连接。 - Feeding Forward
每个node接收来自上一层node的输入时要经过一个sigmoid函数来产生自己的输出,一般都是S形,本例用的tangent函数。
从用户的输入word经过各层的一系列计算得到一个url列表,每个url都有不同的分值。 - Training with Backpropagation. TODO
对于url layer的每个节点:
1
2
3
4
5
error = targets[k] - self.ao[k]
output_deltas[k] = dtanh(self.ao[k]) * error
change = output_deltas[k] * self.ah[j]
self.wo[j][k] = self.wo[j][k] + N * change对于hidden layer的每个节点:
1
2
3
4
5
6
for k in range(len(self.urlids)):
error = error + output_deltas[k] * self.wo[j][k]
hidden_deltas[j] = dtanh(self.ah[j]) * error
change = hidden_deltas[j] * self.ai[i]
self.wi[i][j] = self.wi[i][j] + N * change - 神经网络的设计:
Optimization
stochastic optimization.
Optimization finds the best solution to a problem by trying many different solutions and scoring them to determine their quality.
也许可用Optimization解决的问题:
The primary requirements for solving with optimization are that the problem has a defined cost function and that similar solutions tend to yield similar results.
最重要的是能确定solution representation和cost function。
Group Travel示例
规划一组人的旅行计划,要考虑很多问题,比如每人的往返航班、要租多少辆车、到哪个机场,总花费、在机场等会合的时间等。
people是一个(name, origin)的list。
flights是dictionary,key是origin和destination,value是一个其余细节信息如depart/arrive/price的list。
- Solution Representation
为了让算法对多个问题通用,solution的表达方式应尽量一般化。比较常见的一种就是a list of numbers。
本例中,每个数字表示某人选择了某航班,第一人的来航班、第一人的回航班、第二人的来航班、第二人的回航班…。数字就是当天的第几个航班。
[1,4,3,2,7,3,6,3,2,4,5,3] - Cost Function
要考虑到很多因素,机票钱、在飞机上待的时间、等待会合的时间、航班太早损失的睡眠时间、退车太晚多交的租车钱等等。选择越差,值越高。
Student Dorm示例
一共五个宿舍,十个学生,每个学生可以填两个志愿。
- Solution Representation
算法设计时,为每个宿舍的每个位置指定一个slot,当该slot被占用时就从列表中移出,可以避免非法solution。
slots=[0,0,1,1,2,2,3,3,4,4,5,5]
solution中的数字表示取当前slots中的第几个。如[0,0,0,0,0,0,0,0,0,0]。注意第一个的取值范围在09之间,第二个的取值范围就是08之间。 - Cost Function
学生如果入住了第一志愿的宿舍就加0,第二志愿的就加1,不在志愿内的就加3。
设计Cost Function时的一个小技巧是尽量让理想最优解为0,这样数值出来后对其效果有一个直观认识。
Network Visualization示例
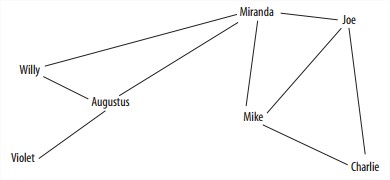
画一些node的关系图时尽量不要让连线交叉。
- Solution Representation
所有node的x,y坐标。sol=[120,200,250,125…],Charlie的坐标就是(120,200)。 - Cost Function
the number of lines that cross each other.
计算每两条link是否相交,如果相交cost就加1,如果两点离得太近就加一个惩罚值。
一些算法:
- Random Searching
随机生成一串solution,然后计算其cost,找最小的。
就是来搞笑的。 - Hill Climbing
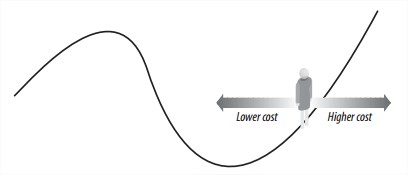
从随机solution开始,然后看相邻的solution是变好还是变坏,朝更好的那个方向走。经过一定数量的迭代或solution稳定时停止。
缺点是local minimum。
- Simulated Annealing
退火算法。从随机solution开始,用一个变量表示温度,最初很高,慢慢降低。在每次迭代的时候,随机选中并改变solution中的一个值。如果新cost更低,采用新solution继续迭代;如果新cost更高,根据的概率来选择采用此solution,所以温度越高,solution跳跃性越大。这其实是为了规避local minimum。经过一定数量的迭代或solution稳定时停止。 - Genetic Algorithms
遗传算法。初始创建一序列随机solution,称为population。每次迭代时,选择所有solution中cost最小的几个,称为elitism,加入到next generation里。这些cost最小的几个solution再经过mutation和crossover,生成足够数量的solution填充到next generation里,使其与之前population数目相同。经过一定数目的迭代后选出population中cost最小的一个。


Document Filtering
Learn to recognize whether a document belongs in one category or another.
示例:
Filtering Spam和Filtering Blog Feeds。
步骤:
有一个Akismet的库可以用,不过是个黑盒,不方便自定义化。
- Feature
feature的选取很重要,既要经常出现又不能没有特点,还要考虑它将集合分解成目标子集的能力。经常需要反复微调。如果某item有某feature,该feature的值就为1。
Filtering Spam例子中只是简单生成了所有独特词的小写形式的dict。改进的方式比如,记录文中大写字母的比例,用词组而非单词,发邮件人的邮箱姓名信息,保持url和数字的完整性等。 - Training the Classifier
训练过程可能是不连续的,应该存入数据库,还是用pysqlite。
fc: 每个classification中每个feature的计数。{'python':{'bad':0,'good':6}, 'the':{'bad':3,'good':3}}
cc: 记录每个classification的计数的dictionary。
getfeatures: 作为参数传进来。是一个dictionary。
train: 传入training set的document后,用getfeatures得到feature组,根据feature组和category,计算上面说的fc计数。此category出现了一次,cc也自增1。
Filtering Spam例子中这样调用cl.train('the quick brown fox jumps', 'good') - Calculating Probabilities
首先求得Pr(word|classification),就是某feature在某category里出现的次数除以该category里所有item的数量。conditional probability常记做Pr(A|B),念作the probability of A given B。
这种情况下最初train的几个sample对结果的影响太大,所以要引入一个合理的初始猜测值,比如0.5,并给猜测值一个weight。(weight*assumeprob + count*fprob)/(count+weight) - Classification Methods:
- Naive Bayesian Classifier
被称为拿衣服是因为它假设要合并的这些概率之间是independent的。节省计算资源。
先计算整篇文档都属于某category的概率,即Pr(Document|Category),如Pr(Pyton&Casino|Bad)=Pr(Python|Bad)*Pr(Casino|Bad)=0.8*0.2=0.16。其实需要知道Pr(Category|Document),根据可计算。
然后决定应该在哪个category,比如筛选垃圾邮件时,宁可放过一千,不可错杀一个。此时可以设置一个threshold,比如第一名的Category其概率要大于第二名的概率乘以threshold时,才选择,不然就选择默认的category。 - The Fisher Method
结果更精确。
首先计算Pr(Category|feature)=(这个category中有这个feature的document的数量)/(所有有这个feature的document)。这个算法假设training set中每种category的样本数量都差不多。 具体计算是这样三步:
clf = Pr(feature|category) for this category
freqsum = Sum of Pr(feature|category) for all the categories
cprob = clf/(clf+nclf)
然后将所有feature的这个概率乘起来,然后用自然对数log一下,再乘以-2。将这个结果交给inverse chi-square function,得到一个0-1之间分布的概率。
最后决定在哪个category,比如概率大于0.2而小于0.6的标记为unknown。 - 其他supervised learning methods也可以用。比如之前说的artificial neural network,可以让features做input,不同classifications做output;之后要讲的support vector machines也可以用。这些方法的优点是可以捕获更多细微关联,feature之间互相的影响关系interdependence可以捕获到。
- Naive Bayesian Classifier
Modeling with Decision Trees
Decision Tree
简单直观易解读。训练后看结果就像用树的方式表现的一系列if-then语句。对输入数据也不挑剔。
缺点是对于有很多可能结果的数据比较无力。对于数字只有大于或小于这样的判断,如果稍微复杂些,比如是两个变量的差值,树的分支就会变得非常多以至于没法用。
所以不适于有很多数字输入输出的、输入数字数据间关系比较复杂的情况,比如interpreting financial data或image analysis。适用于有很多分类数据和离散数字数据、理解选择过程很重要的情况。
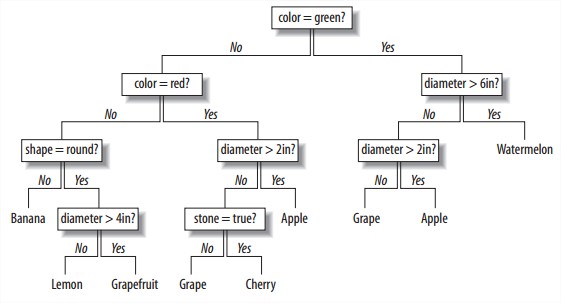
三个示例:
- How to predict which of a site’s users are likely to pay for premium access.
清晰很重要,要知道让用户付款的具体原因,改变广告策略等。所以要用decision tree。
收集一些信息类似:
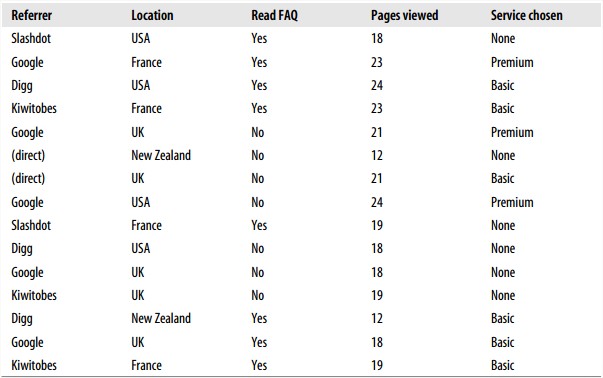
- 表示一棵树的数据结构
decisionnode类包含:
col表示评价标准列表号;value表示该列的值要满足此value才是true;tb和fb是truebranch和falsebranch,下一个分支;results存储该分支中某结果出现的次数,非叶节点分支都是None。 - 训练这棵树
算法名字叫CART(Classification and Regression Trees),创建一个root node后,考虑每个标准,选择一个能最好区分数据的标准列,分成两个分支。 - 选择能最好区分数据的数据列的方法
标准是measure how mixed a set is。我们的目标是分成两组之后,两组mixed程度之和小于原来一大组mixed的程度,差值就是information gain,选择效果最好的那列。- Gini Impurity
The expected error rate if one of the results from a set is randomly applied to one of the items in the set.
比如有4个分类分别有1/2/3/4个,那么计算出的error rate就应该是。
这个值越高,采用此标准split就越差。 - Entropy
The amount of disorder in a set, how different the outcomes are from each other.
The entropy function calculates the frequency of each item (the number of times it appears divided by the total number of rows).
p(i) = frequency(outcome) = count(outcome) / count(total rows)
Entropy = sum of p(i) x log(p(i)) for all outcomes
- Gini Impurity
- 递归地建造这棵树
每次遍历剩余评价标准,选择information gain最高的一列split,然后再对每个分支进行重复操作。直到split的information gain不再大于0为止。 - 绘制树
用Python Imaging Library。 - 对新数据应用决策树
递归。 - 简化这棵决策树,避免过拟合
为避免split一次效果不好,后续继续split效果很好的情况。还是要执行前面的过程,然后再试图合并多余的节点,pruning。
算法是每次检查两个同parent的叶节点,看看合并他们的话增加的entropy是否小于一个预定的阈值。如果小于,就合并这两个叶子节点。 - 当数据不完整时
比如缺少某个指标的值,只要在不知转到哪个branch的时候两个都转就是了。注意的是每个branch的weight不一样。这个weight就是该分支下item个数除以两个分支item的总数。 - 当输出结果是数字时
比如之后的两个例子housing prices和hotness。如果还用之前的评判标准,不同的数字会变成不同的结果,那结果分支就海了去了。
所以不用entropy或Gini impurity,用variance来作为scoring function。就是方差。
- 表示一棵树的数据结构
- housing prices和hotness
方法没有什么不同,只是数据收集和处理的方式不同,总之都要整理成一列列那个数据结构。
Building Price Models
用kNN来对有many different attributes的numerical data做prediction,例如prices。
做numerical predictions比较重要的就是要确定哪些变量最重要并以哪种方式组合在一起。
kNN的缺点是运算量太大因为每两点之间的距离都要计算,决定weight和variable取舍也比较困难,虽然可以用optimization,但数据较多的情况下也要花费很多时间。
kNN的优点是新数据添加进来不太费劲,知道weight后也很容易理解每个variable所起的所用。
例子:预测红酒价钱
数据是自造的{‘input’:(rating,age), ‘result’:price}。
- k-Nearest Neighbors
左邻右舍都是什么价钱,然后平均一下。
选择做参照的邻居数既不能太多(不精确)也不能太少(过拟合)。确定合适的邻居数目可以用之前学习的Optimization方法。
kNN首先要知道如何定义两个item的相似度,也即它们之间的距离,可以用Euclidean distance(前文有介绍)。 - Weighted Neighbors
这些邻居与自己的距离不同,对自己的影响力也应不同,近的邻居对自己的影响力应该大一些。
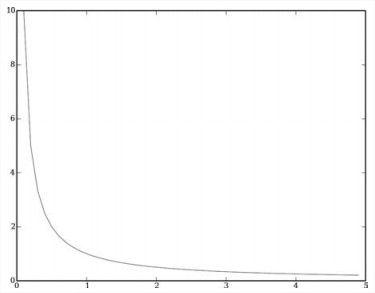
距离与影响力之间的转化关系可以有这么几种:- Inverse Function
如weight = num / (dist + const)。
速度快,缺点是近的邻居的影响力很大,稍微远一点就迅速衰减,有可能会比较容易受噪音数据影响。
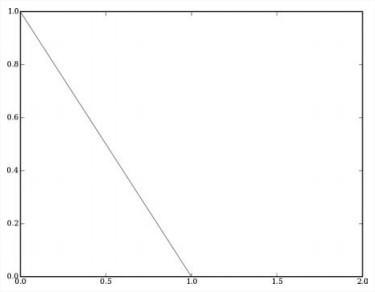
- Subtraction Function
就是从distance里减去一个常量,负数全为0。
不会给近的邻居过大的权重,但常量的选择要注意,有时可能根本没有邻居算是近了。
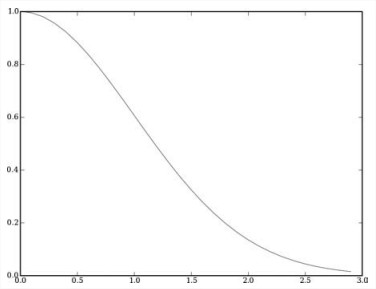
- Gaussian Function
也叫作bell curve。稍复杂一点,速度没那么快,不过效果好。
math.e**(-dist**2/(2*sigma**2))
- Inverse Function
- 验证算法好坏的方法:Cross-Validation
把数据分成training set和test set。看一下错误率,error = sum(real - guess)^2 / testset_length,用平方会让(一般表现很好偶尔表现极坏的算法)比(无论什么情况都不会太坏的算法)不受待见一点。 - Heterogeneous Variables
输入数据间尺度并不相似对结果也不是同等重要。自造数据改成{‘input’:(rating,age,aisle,bottlesize),‘result’:price}。- Optimizing the Scale
用之前学习的Optimization方法,需要specify a domain that gives the number of variables, a range, and a cost function。此处crossvalidate可以评判一个算法好坏,稍作改写就可以作为cost function。
用退火算法。optimization.annealingoptimize(numpredict.weightdomain, costf, step=2)。
用遗传算法,慢但更准确。optimization.geneticoptimize(numpredict.weightdomain, costf, popsize=5, lrate=1, maxv=4, iters=20)。
一下就可以看出哪些变量更重要,有多重要。
- Optimizing the Scale
- Uneven Distributions
有时有某些数据很重要而我们并未收集。比如红酒例子,买家购买可能有两个渠道:从专卖店买的,和半价从折扣店买的,而我们并不知道。
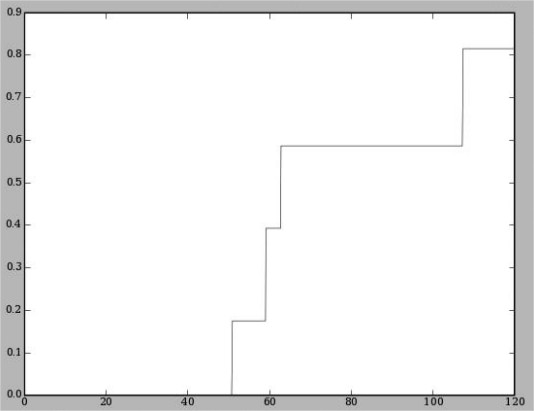
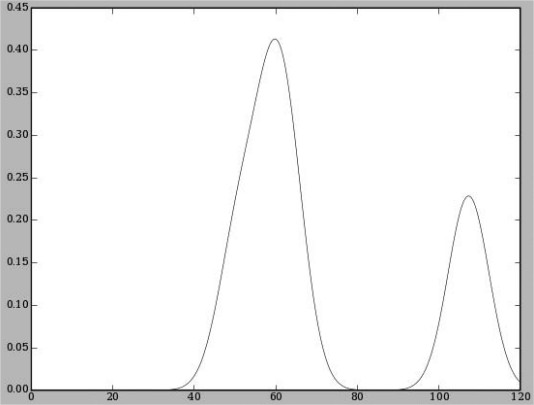
Estimating the Probability Density,评估一下一个item落在某个区间的概率,比如红酒例子,输入99 percent和20 years,得到说50%可能性价格在40-80之间,50%可能性价格在80-100之间。
算法是计算在某个指定区间内所有邻居的weight之和,除以所有邻居的weight之和。
可以用matplotlib绘制不同区间的概率值。
如果画cumulative probability graph就比较容易。也可以看出60和110那里有较大跳跃。
画probability density graph就麻烦一点,assume the probability at each point is a weighted average of the surrounding probabilities, much the same as the weighted kNN algorithm。用gaussian对旁边邻居值做平滑。
还有一个用eBay API的实际例子。
Advanced Classification: Kernel Methods and SVMs
直接给算法丢一堆复杂的数据然后希望出一个好结果是不可能的,认真对数据做预处理,认真选择合适的算法是不可或缺的。
介绍Linear Classifiers和kernel methods
以一个约会网站匹配的数据为例。有两个人的信息,预测他们是否匹配。
- 输入数据的处理
- 原始输入数据
信息有Age,Smoker?,Want children?,List of interests,Location,然后匹配数据是两个人各自的信息和匹配结果,大概是这样:39,yes,no,skiing:knitting:dancing,220 W 42nd St New York NY,43,no,yes,soccer:reading:scrabble,824 3rd Ave New York NY,0。
可以看到数据非线性且相互关联,此时可以单独将每项抽出来用matplotlib看看分析图,便于更好地理解数据并处理。 - 将分类信息转为数字信息
本章讲的算法都只能处理数字输入项,需要把所有输入信息都转化成数字项。- Yes/No Questions将yes转为1,no转为-1,缺失数据转为0。
- Lists of Interests,在本例中是两人匹配,所以可以将两人的共同兴趣数作为变量,缺点是会丢失一些兴趣组合相互关联的信息。另一种方式是将每个兴趣都单独给一个变量值,不过这些兴趣需要事先按照层级组织好,比如skiing和snowboarding都属于snow sports类。如果两人都对snow sports感兴趣,但子类型不一样,此时可以给两人共同兴趣数加个0.8,层级越接近根节点,加分越少。
- Determining Distance Using Yahoo!Maps。两人的位置信息通过雅虎的接口转化为经纬度,然后再转为距离。
- Scaling the Data
将数据标准化一下,全部变成最小是0,最大是1。
- 原始输入数据
- 最基本的Linear Classification
找到每个分类的平均中心点,然后计算新输入数据距离哪类的中心更近就属于哪类。图中是只考虑年龄一项时的情况。由于是Linear classifier,所以只是一条dividing line
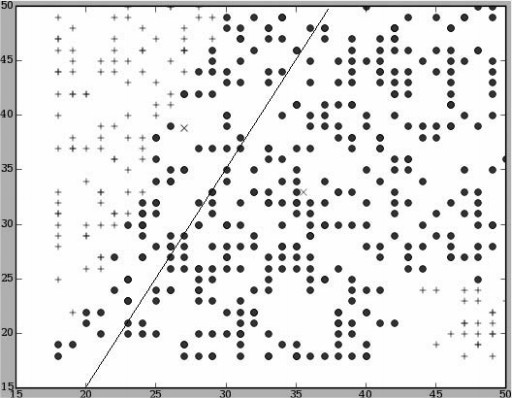
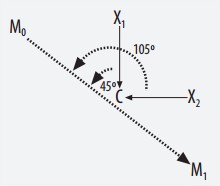
此处计算距离使用vector和dot-products。利用向量点乘后正负值能看出方向的特性判断距离。图中M0和M1是两类的平均点,C是他们的中点,X1和X2是另两个待分类的点。于是计算M0M1与X1C之间的点乘为正,离M0近;M0M1与X2C之间点乘为负,离M1近。
advancedclassify.dpclassify(scalef(numericalset[11].data), avgs) - Kernel Methods
所有使用点乘的算法都可以用到kernel trick技巧。The kernel trick involves replacing the dot-product function with a new function that returns what the dot-product would have been if the data had first been transformed to a higher dimensional space using some mapping function.也是输入两个向量,输出一个值。其中一个在实际使用中常见的transformation叫作radial-basis function,接收一个gamma的参数。还好原空间中点的平均值点做转换,和在转换空间中点的平均值一样。
advancedclassify.nlclassify(scalef(newrow), scaledset, ssoffset)
Support-Vector Machines及现成的库LIBSVM
- Support-Vector Machines
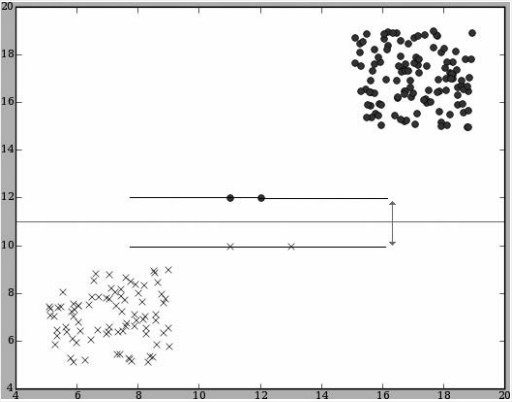
在寻找dividing line的时候寻找离两个分类尽量远的线,只受在margin范围内的点的影响,maximum-margin hyperplane。在线附近的那些点就是support vectors。
- Support-Vector Machines常被应用到的领域:
data-intensive scientific problems and other problems that deal with very complex sets of data。一些例子:- Classifying facial expressions
- Detecting intruders using military datasets
- Predicting the structure of proteins from their sequences
- Handwriting recognition
- Determining the potential for damage during earthquakes
- Support-Vector Machines常被应用到的领域:
- 使用LIBSVM
用到的数学知识很多,所以本书直接用了一个开源库,LIBSVM。
是用C++写的,一个wrapper是svm.py。
1 | # training |
还有一个用Facebook的API做实际开发的例子,主要是处理数据,然后用LIBSVM训练。
Finding Independent Features
Unsupervised, extract the important underlying features from sets of data that are not labeled with specific outcomes.
Feature extraction tries to find new data rows that can be used in combination to reconstruct rows of the original dataset, each row is created from a combination of the features.
经典的用Feature extraction解决的问题有cocktail party problem(区分多人说话背景下每个人说话的声音),在一堆文档中找到重复出现的遣词造句模式。
例子:找出多篇文章各自的不同主题
-
准备数据
用Universal Feed Parser抓一些文章,分词,得到三个列表:
allwords记录所有文章中某个词出现的次数。allwords[word]=count。
articlewords记录每篇文章中某词出现的次数。articlewords[articleindex][word]=count
articletitles记录每篇文章的标题,是一个list。
去掉最常见的词和最不常见的词,只留下至少在3篇但不超过总数60%的文章中出现过的词,构造以word为列以article为行,值为该词在该文章中出现次数的矩阵。 -
Non-Negative Matrix Factorization
- 介绍
NMF, factorize the matrix,构造两个较小的矩阵,可以相乘重建原矩阵。之所以叫non-negative是因为两个较小矩阵中不能有负值。
这两个矩阵分别是:
The features matrix: 每行是一个feature,每列是一个word,值表示某个word对于某个feature来说有多重要。每个feature代表这些文章中的一个主题。
The weights matrix: 每行是一个article,每列是一个feature,值表示某个feature对某个文章的应用匹配度。


之前的article/word矩阵就用这两个矩阵来重建。

矩阵乘法在python中可以使用NumPy库。matrix的乘法是矩阵乘法,array的乘法是行列完全相同的两矩阵对应值分别相乘。 - 算法
类似之前Optimization那章讲的内容。
cost function是相乘后的两矩阵中的每一值减去原矩阵的值,差值的平方之和。
不断更新矩阵的算法,此处不再用annealing或swarm,一个新算法叫作multiplicative update rules,要使用4个中间矩阵。
1
2
3
4
5
6
7
8
9
10
# w is weight matrix, h is feature matrix, v is original data matrix
# hn, hd, wn, wd
# update feature matrix
hn = (transpose(w)*v)
hd = (transpose(w)*w*h)
h = matrix(array(h)*array(hn)/array(hd))
# update weights matrix
wn = (v*transpose(h))
wd = (w*h*transpose(h))
w = matrix(array(w)*array(wn)/array(wd)) - 介绍
-
显示结果
可以输出每个feature最具影响力的5个word,每个article最具影响力的3个feature,或某个feature最影响哪些article。
例子:Stock Market Data
从Yahoo! Finance下载trading volume的数据。整理数据,构建矩阵。运行NMF算法。显示结果。人脑分析看看有什么关联性。
Evolving Intelligence
Instead of choosing an algorithm to apply to a problem, you’ll make a program that attempts to automatically build the best program to solve a problem.
一个写算法的算法,genetic programming。
Genetic Programming
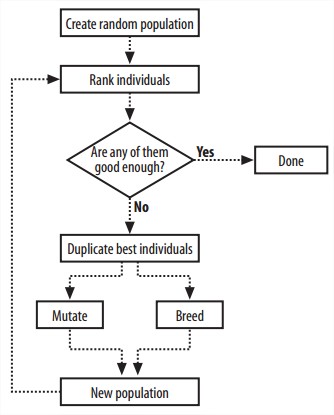
Genetic Programming和Genetic Algorithm的区别是,genetic programming不只是将一系列parameter引用到指定算法,从算法本身到其要用的参数都是它自己生成的。
- Programs As Trees
用树来表示一段程序,parse tree。
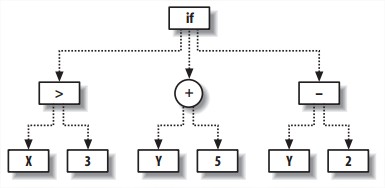
此例等同于如下代码:
1 | def func(x,y) |
- 在python中构造这样的树
需要这样几个类,凡是节点类都包含一个evaluate函数,输入值是用户参数,返回该节点计算出的值。详细要看代码。
fwrapper: 表示function的数据结构,为了让function node使用,成员包括函数名称、函数自身和参数数量(也就是子节点的数量)。
node: 表示function node。构造时接受一个fwrapper。evaluate函数得到其子节点的evaluate值,并对其应用自己的function。
paramnode: 只是返回传给程序的参数中的某一个。evaluate函数返回第idx个的参数值。
constnode: 返回一个常量的节点。evaluate函数就是返回一个常量。
例子:模拟数学方程
- Creating the Initial Population
创建一些function,包到fwrapper里,记录到flist这个列表中,以后生成树的函数节点时会用这些做原材料。
makerandomtree,随机生成三种node,递归生成一棵树。 - Testing a Solution
如果我们知道实际要模拟的正确函数是什么,还是用Optimization中的方法,定义一个scorefunction,计算正确值与错误值之间差值的绝对值之和。 - Mutating Programs
不要mutate太多。从根节点开始,如果随机数小于某个阈值,就突变,不然就递归地问子节点们要不要突变。两种方式:- Mutation by changing node functions
修改函数节点,参数数量都有可能变化。
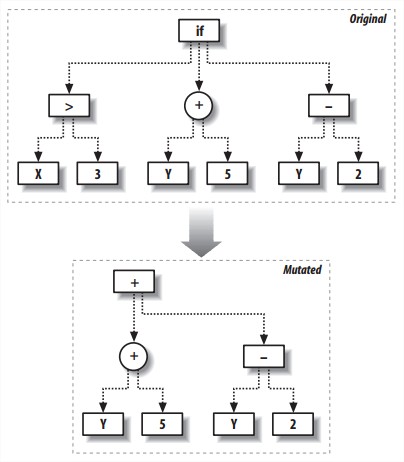
- Mutation by replacing subtrees
替换整棵子树。更好实现。
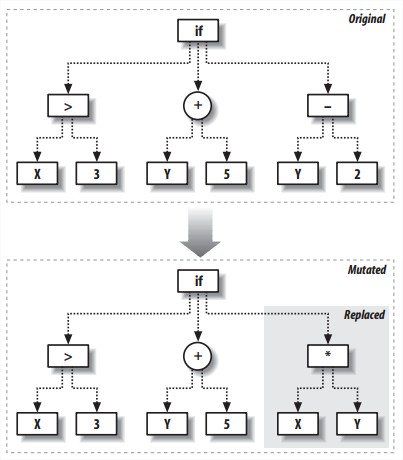
- Mutation by changing node functions
- Crossover
同时遍历两棵树,如果随机数小于某个阈值,就将第一棵树走到的这个分支换成第二棵树的。同时遍历这两棵树是为了crossover发生时两棵树的深度差不多。
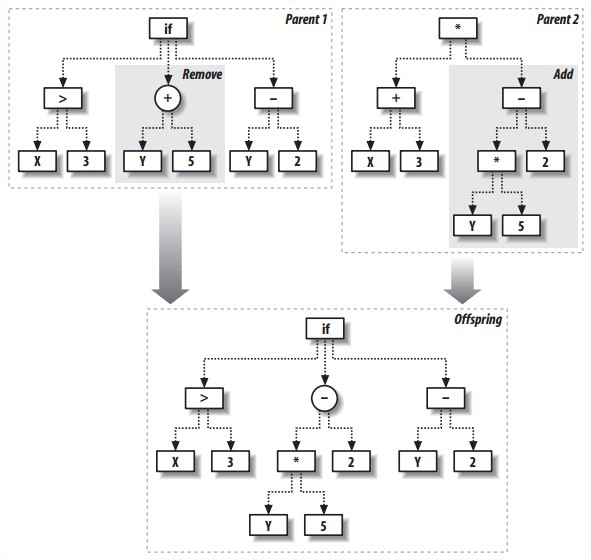
- Building the Environment
不同方案彼此竞争的地方。
evolve,先初始创建一群population,对其rank进行排序,将最好的两个直接放到下一代,然后对其余优等生mutate又crossover补齐population数量,小概率创建一棵全新的树加进去。迭代。
gp.evolve(2,500,gp.getrankfunction(gp.buildhiddenset()),mutationrate=0.2,breedingrate=0.1,pexp=0.7,pnew=0.1)
生成的结果function往往复杂冗余,也许手工精简下,某些情况下可以用pruning algorithm。
Genetic Programming中多样性是比较重要的,不然可能会local maxima。策略应该是survival of the fittest and luckiest。
例子:模拟棋牌游戏玩家
游戏玩法是这样的,两个玩家,棋子可以往四个方向走,走到对方棋子所在的位置对方就输了,如果连续两次向同一个方向移动也是输。
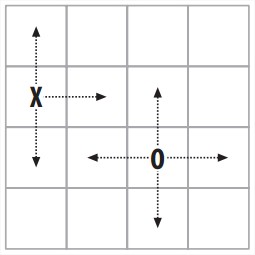
- Creating function
相当于前例的Testing a Solution,不同的是我们直接让两玩家比较决定优劣,而不是前例中每个树和正确值比较,然后按照分值排序。
模拟两个玩家对战的函数,输入值是两棵树[player1,player2],返回值是赢的玩家的序号。 - A Round-Robin Tournament
相当于前例的Building the Environment
机器生成的玩家们先进行充分对战。population作为输入,分别两两对战,记录每个树输掉了多少局,排序,返回排序后的玩家列表。
winner=gp.evolve(5,100,gp.tournament,maxgen=50) - Playing Against Real People
和真人对战测试感受一下。
和前面筛选出的树对战,定义一个humanplayer类,里面也实现一个evaluate函数,告诉用户当前棋局,让用户选择一个方向,返回这个方向。
更多可改进之处
- More Numerical Functions
现在的元function集合还比较小,可以更丰富复杂些,当然也要看需求是否需要。可以增加如:- Trigonometric functions like sine, cosine, and tangent.
- Other mathematical functions like power, square root, and absolute value.
- Statistical distributions, such as a Gaussian.
- Distance metrics, like Euclidean and Tanimoto distances.
- A three-parameter function that returns 1 if the first parameter is between the second and third.
- A three-parameter function that returns 1 if the difference between the first two parameters is less than the third.
- Memory
当前实现是完全reactive的,不适于longer-term strategy。为了适用,需要存储可以用在以后回合的信息。可以创建一些新类型的node。比如:
store node有a single child和an index of a memory slot,它从child那里获取值然后存储在memory slot里,然后传递给它的父节点。
recall node没有children,只是返回某地址储存的值。
如果store node在树的顶端,树中的任何一部分的recall node都可以拿到结果值。
也可以设置多程序共享的shared memory。 - Different Datatypes
当前实现只接受integer参数,返回integer结果。还应处理其他类型数据,需要改动node上的那些函数。比如支持这些类型:- Strings. These would have operations like concatenate, split, indexing, and substrings.
- Lists. These would have operations similar to strings.
- Dictionaries. These would include operations like replacement and addition.
- Objects. Any custom object could be used as an input to a tree, with the functions on the nodes being method calls to the object.
- 实现时则:
改写fwrapper类,让params不再只是接收参数数量,而是接受一个定义参数类型的list。
flist也不再只是特定的fwrapper的列表,而是指定了返回值类型的dictionary,如flist={'str':[substringw,concatw], 'int':[indexw,addw,subw]}。
然后在makerandomtree生成树的时候,遍历每个可以的参数类型,在flist里找对应的函数。crossover函数也是一样。
Algorithm Summary
Bayesian Classifier
前文Document Filtering,讲了如何创建一个document classification system,用来筛选垃圾邮件或是根据一些事先不知的关键词将不同文档分类。
Bayesian classifier只能应用于可以转化为feature list的数据,feature就是某item有或没有的某项特质。
Training
supervised method。需要training。输入数据是features的值列表和所属的分类,可以一条条输入,无需一次性都给classifier。classifier不断更新计算每个feature和每个category相关的概率。A trained classifier is nothing more than a list of features along with their associated probabilities.不需要记录训练时的原始输入数据。
Classifying
需要将一个要鉴别的item中的每个feature的概率值组合起来,组合成这一整个item在每个category的概率。一种方法是:
Pr(Category|Document) = Pr(Document|Category) * Pr(Category)
Pr(Document|Category) = Pr(Word1|Category) * Pr(Word2|Category) * ...
Using Your Code
对原始数据的处理需要一个feature-extraction函数,就是把原始数据处理成一系列features。只要接受一个object然后返回一个list的函数就可以。
docclass.getwords('python is a dynamic language') # {'python':1, 'dynamic':1, 'language':1}
接下来就可以使用之前说的算法:
1 | # training |
Strengths and Weaknesses
- Strength:
training和数据查询速度快,training和classifying的过程只是数学上对并不多的feature们的概率的数学计算。并且training还可以是渐进的。
对结果的解读比较直观,因为可以看到每个feature的概率,于是可以看出区分两个category最有效的feature是哪些。 - Weakness:
无法处理feature间的组合关系。
Decision Tree Classifier
前文Modeling with Decision Trees讲了如何从server logs建立用户行为分析。
Training
从root节点开始,每次选择一个属性,以其为标准把数据分割为两部分,递归直到没有information gain。选择最佳的分割方案需要用到entropy(the amount of disorder in a set)。
p(i) = frequency(outcome) = count(outcome)/count(total rows)
Entropy = sum of p(i) * log(p(i)) for all outcomes
然后计算information gain:
weight1 = size of subset1 / size of original set
weight2 = size of subset2 / size of original set
gain = entropy(original) - weight1 * entropy(set1) - weight2 * entropy(set2)
Using Your Decision Tree Classifier
原始输入数据如下,前面是一系列值,最后一列是属于哪个分类。
1 | fruit = [ |
然后train并classify。
1 | tree = treepredict.buildtree(fruit) |
Strengths and Weaknesses
- Strength:
结果极易解读,最重点的都在树顶端。可以将分类数据与数字数据混合使用。
比Bayesian classifier强的是可以处理有关联的变量。 - Weakness:
不擅长处理数字结果。不支持渐进训练。树可能变得很庞大。
Neural Networks
前文Searching and Ranking讲了根据用户过去的点击对搜索结果进行排序。Neural network用于classification和numerical prediction问题。本书用的叫做multilayer perceptron network。包含数层neuron,neuron之间有synapse连接。
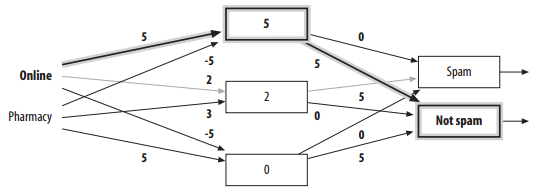
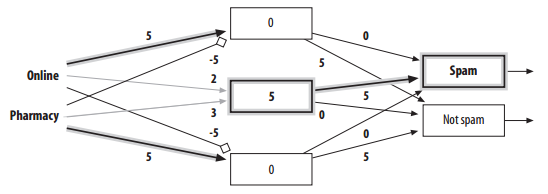
针对前文Bayesian Classifier中spam的例子,neural network可以解决online和pharmacy组合的问题。因为有多层neuron,所以可以模拟出相互之间的关联。
只输入Online的情况:
输入Online和Pharmacy情况:
Training a Neural Network
backpropagation。初始随机值,输入一个例子,如果输出是错误的,就修改相关synapse的weights。公式见前文。
Using Your Neural Network Code
并不是直接使用work,而是都有一个number ID。
1 | import nn |
Strengths and Weaknesses
可以处理复杂非线性数据,找到他们之间的关联。任何数字都能作为输入。也可以渐进training。只要记下synapse weights就可以了,不用记住以往示例。
黑箱策略,难以解读。选择training rate和network size的时候没有一定之准,只能不断试错调节。
Support-Vector Machines
前文Advanced Classification: Kernel Methods and SVMs。SVMs接受数字输入然后试图输出它们属于哪个分类。
寻找两个分类间的dividing line。
The Kernel Trick
取代dot product的操作,相当于在转换后的空间操作,应用于dividing line不再是线性时。
比如将dotproduct(A,B)换为dotproduct(A,B)**2。
Using LIBSVM
You can use it to train on a dataset(to find the dividing line in a transformed space) and then to classify new observations.
1 | from random import randint |
验证某kernel function效果如何:
1 | guesses=cross_validation(prob,param,4) |
Strengths and Weaknesses
如果参数调的好,效果也不是一般好。training之后classify时速度很快。通过把分类数据转为数字数据,可以同时处理两种数据。
缺陷是对于每个dataset,参数都不一样,需要慢慢选择调节。需要较大的数据库来进行cross-validation。黑盒数据,难以分析,并且是在高维空间里。
K-Nearest Neighbors
前文Building Price Models和Discovering Groups。k个邻居的平均值。也可以根据邻居的远近设定weight。
Scaling and Superfluous Variables
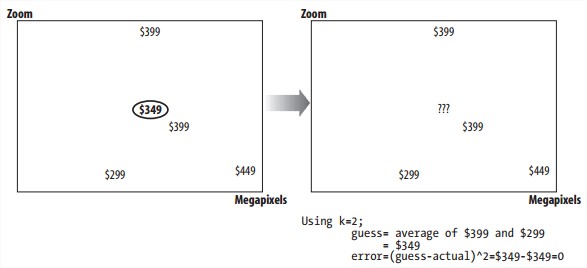
变量值应先统一在一个尺度里,通过cross-validation也可以去掉影响不大的变量项。Cross-validation removes items from the dataset and then tries to see how well it can guess them using the rest of the data.
Using Your kNN Code
1 | cameras = [ |
Strengths and Weaknesses
做数字预测却仍易于解读。scale的过程还能了解到哪些variable是有用的。是online technique,可以实时添加数据,并且不需要额外计算。
缺点是总是需要所有的training data来做预测,空间时间消耗都多。用cross validation做筛选的时候也需要进行相当的计算量,也很枯燥。
Clustering
Hierarchical clustering和K-means clustering是unsupervised learning technique。前文Discovering Groups。
Hierarchical Clustering
不断合并最近的两个group。可以用dendrogram绘制一个树形图。
K-Means Clustering
用户自己确定要分成几组,每个item找离自己最近的中心点,中心点每次调整自己到关联item的正中心,多次迭代。
Using Your Clustering Code
需要dataset和distance metric。The dataset consists of lists of numbers, with each number representing a variable. Distance metric比如Pearson correlation或Tanimoto score或Euclidean distance。
1 | data=[[1.0,8.0],[3.0,8.0],[2.0,7.0],[1.5,1.0],[4.0,2.0]] |
拿到一个新dataset可能没概念要分成几组,此时可以先用hierarchical clustering,然后再用k-means clustering。
或者可以用K-means clustering先分成几组,然后把每组的中心点根据hierarchical clustering组成树结构。
Multidimensional Scaling
前文Discovering Groups讲到这种unsupervised的用于更好理解结果的方法。
原始的高维数据转成二维或三维的数据并绘制出来。
根据原始数据,用Euclidean distance计算出两个item之间的距离。随机给每个item一个二维坐标,计算它们之间的距离,与正确的距离比较,并按比例更正一点,迭代。
Using Your Multidimensional Scaling Code
1 | # scale |
Non-Negative Matrix Factorization
前文Finding Independent Features,处理数字输入,unsupervised,可以找出每个item有哪些feature和它们的weight,这些feature又何种程度受哪些具体输入影响。
算法是将原矩阵(article/word)分割成两个矩阵(feature/word)(article/feature)。这两个矩阵初始从随机值开始,然后根据update rule更新(详细见前文),不断迭代。
Using Your NMF Code
1 | from numpy import * |
Optimization
见前文Optimization。用某些算法生成一些solution,选择使cost function值最小的,不断迭代。
The Cost Function
小心local minima。
Simulated Annealing
从随机开始,然后平移一小段距离,如果cost function变低,就选新的这个solution,如果变高,按照一定几率temperature选择新solution。temperature逐渐降低,算法越来越保守。
Genetic Algorithms
从随机population开始,然后精选后,mutation和crossover之后组成新population,不断迭代。
Using Your Optimization Code
1 | import math |
对于每个问题,应该运行几次optimization算法来调整参数。